Overview
I obtained a database of millions of short beer reviews, which I have generated graphs and word clouds from and performed a small amount of analysis.
I made use of matplotlib along with the python wordcloud library, to generate graphs and word clouds respectively.
Styles
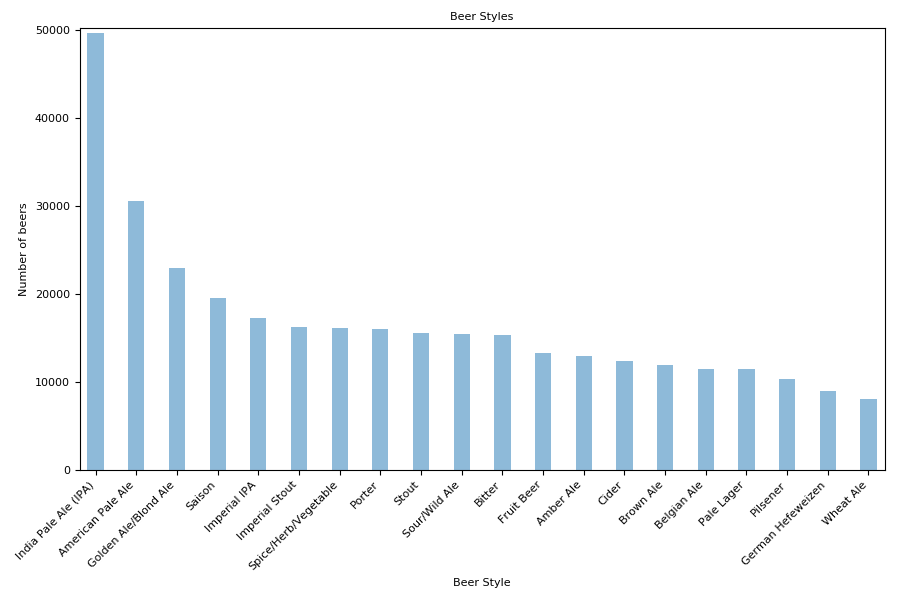
The following graph depicts the number of beers for the top 20 beer styles.
The top style of beer by a far distance is the IPA, followed by the American Pale Ale.
Popular Words
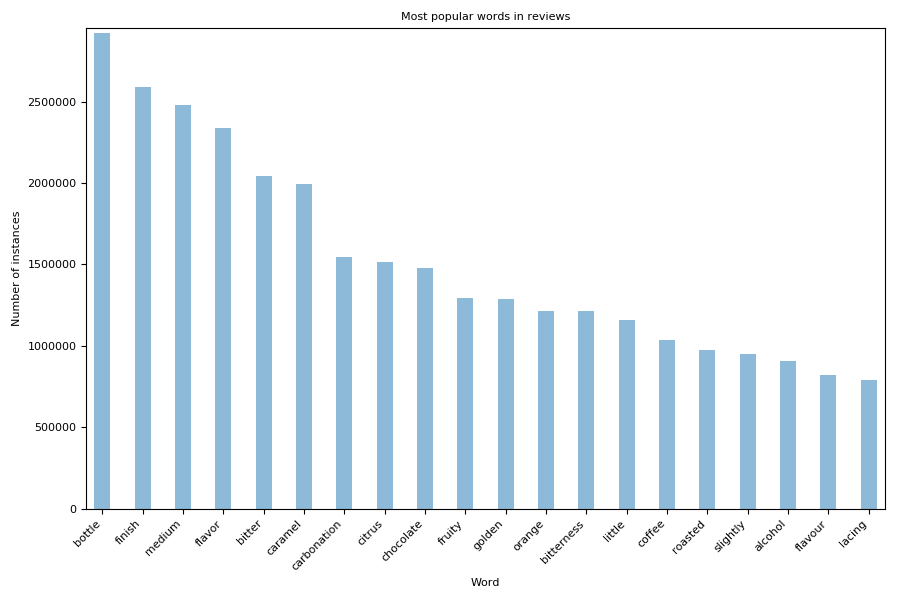
The following graph depicts the most popular words used in reviews (ignoring stop words).
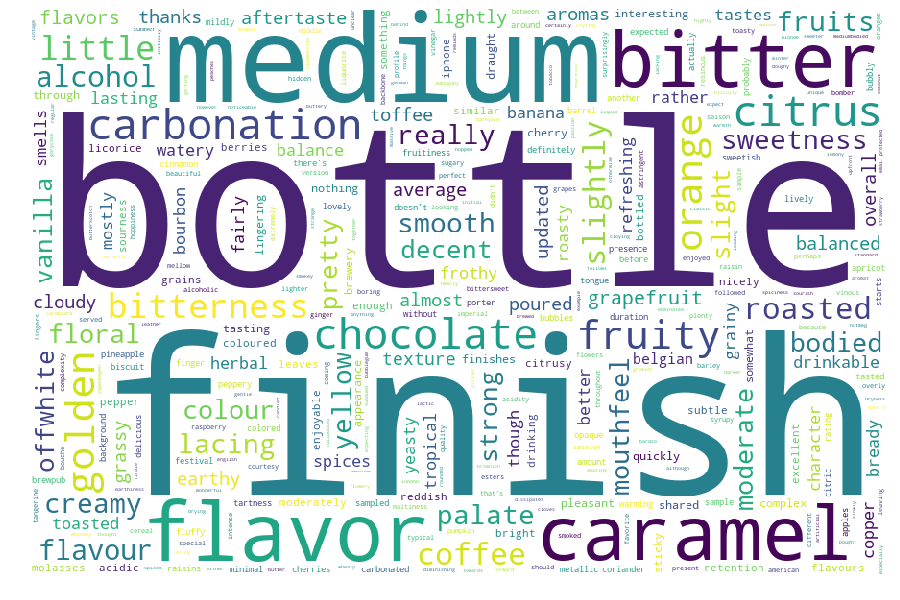
The following image depicts a word cloud of the most popular words.
Popular Words from very positive ratings
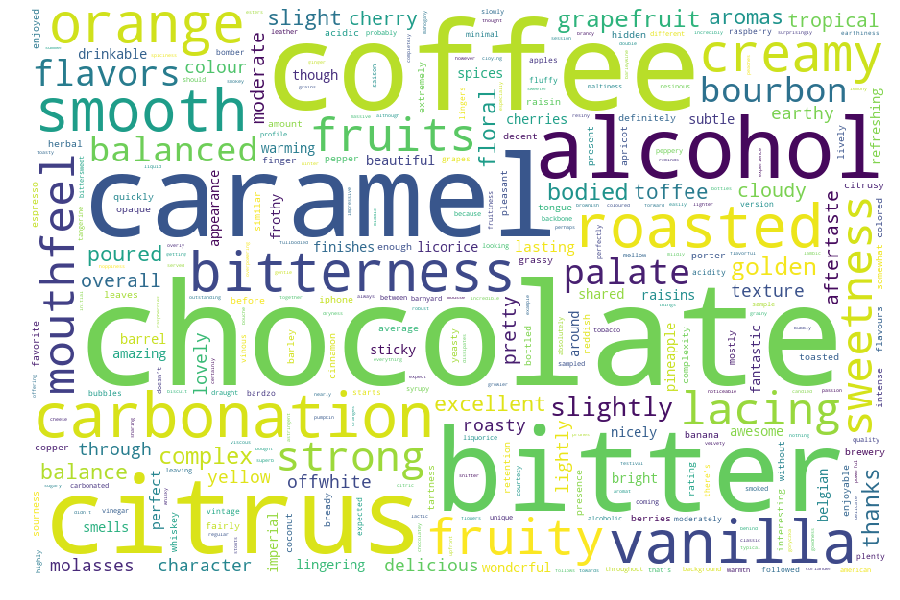
For this and the next word cloud, I removed words such as “bottle,flavour,flavor,really”, to try to obtain words which describe the beer in terms of flavour and appearance.
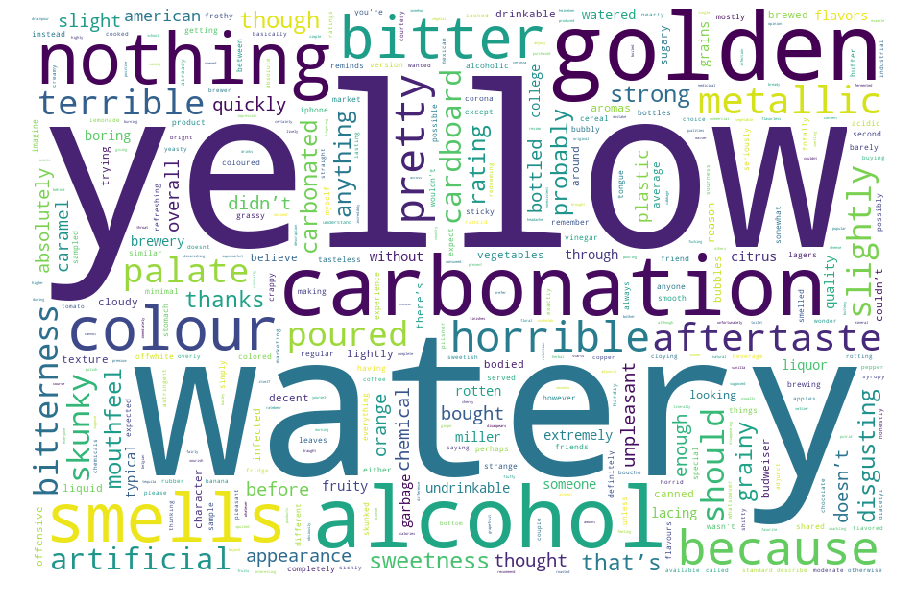
Popular Words from very negative ratings
ABV (Alcohol By Volume)
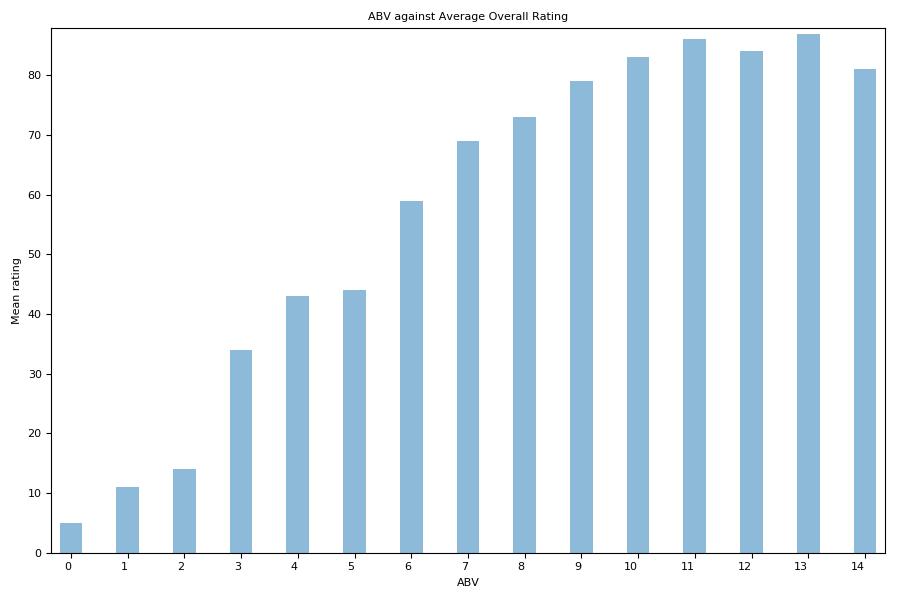
I found the following graph to be very interesting, there seems to be a noticeable correlation between the overall score of beers and the alcoholic content.
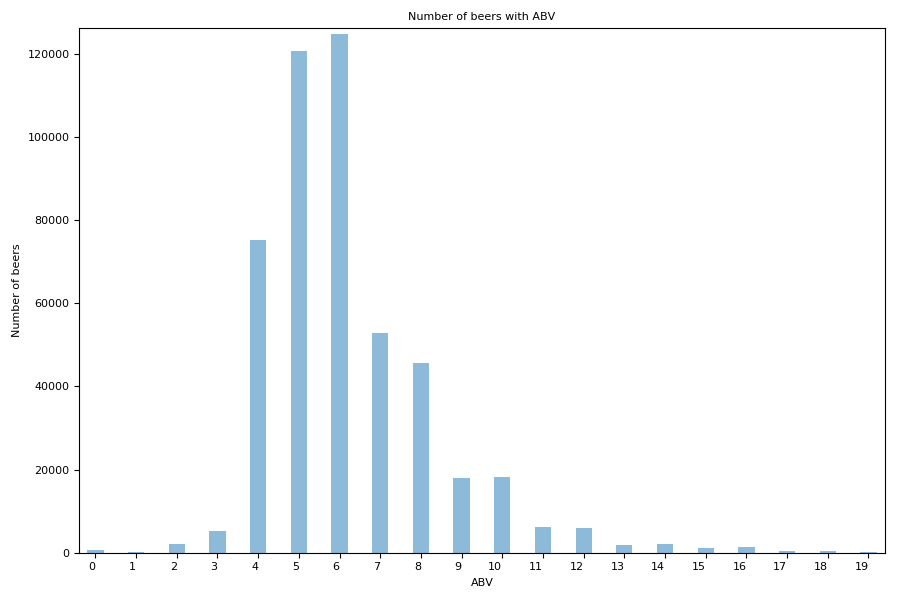
You can see the most common ABV of a beer is around 6%.
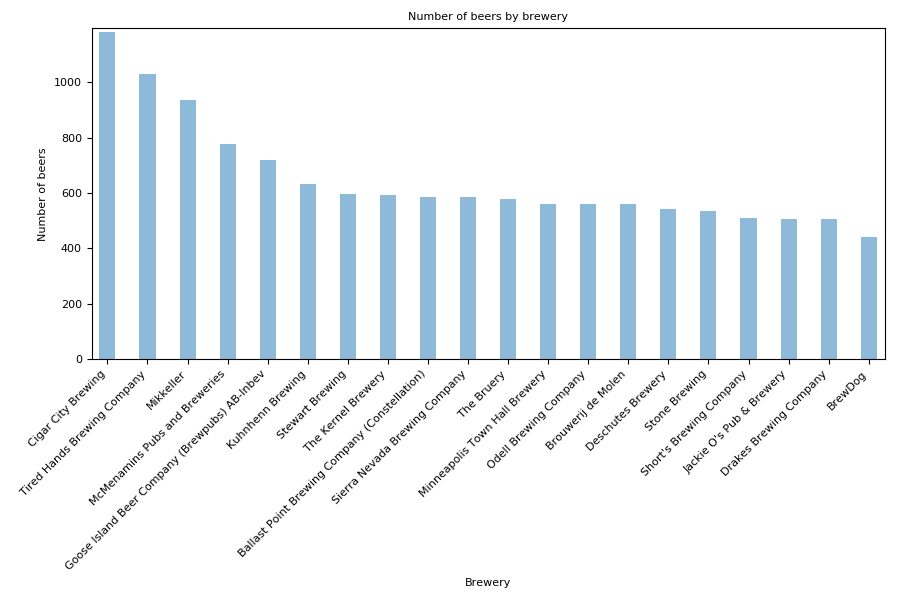
Number of beers produced by breweries
The following graph shows how Cigar City leads in the number of beers they have produced.
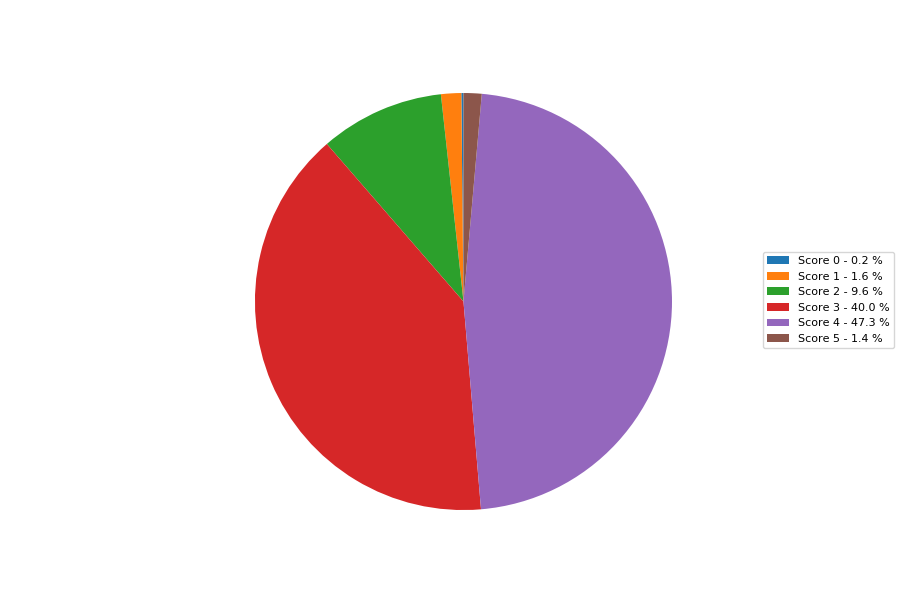
Distribution of scores
The following graph shows how scores of 0 to 5 are distributed across reviews.
2 Comments
Leave Comment
Error

Ed
Very interesting
AdrienM
The negative review word cloud is not shocking for sure. But the positive cloud is surprising considering the current IPA rage. I guess this follows through with the ABV stats as not many brews are high ABV, and those that are, likely focus on rich rather than fruity flavors. And this is what gets better reviews. (also I think the hop-wars have produced too many terrible beers with little understanding of how to use hops properly, though that is thankfully changing)
A very interesting analysis indeed. (and I had no idea Cigar City was that prolific!)